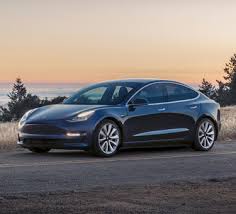
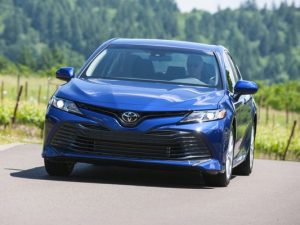
Is a Tesla Model 3 Really Cheaper to Own than a Toyota Camry? Part 1 – The USA


There have been a number of articles written recently on the analysis by ARK investments on a Tesla 3 being cheaper to own on a per mile basis than a Toyota Camry including onThe Driven and Clean Technica
I have done a deeper dive based on a look at the model that ARK has used and also using Australian numbers to look at the application of the numbers for the Australian market. Due to the complicated nature of the question I have split this into two posts. The first is on the ARK model. The second is on looking at that model in an Australian context.
I will include access to the spreadsheets that I have created once I have finished the post on the Australian context.
The ARK Model
Two Key Factors
In terms of the model itself, the spreadsheet that ARK has created is relatively straightforward but it is highly dependent on two factors. The first is the mileage assumed per year and the second is the second-hand value of the vehicle.
Mileage is important because higher mileage figures advantage an electric car because of their lower running costs. For mileage, ARK has used 15,000 miles a year (21,140 km) which surprised me because the average here in Australia is much lower than that. When I dug down into some of the details. The US Dept of Transportation says the average is 13,476 miles while the 15,000-mile figure appears to relate to 20-34 year old drivers. However, as you can see in the following table from the same web page there is a considerable difference between men and women and the different age groups.
| Age | Male | Female | Average |
| 16-19 | 8,206 | 6.873 | 7,624 |
| 20-34 | 17,976 | 12,004 | 15,098 |
| 35-54 | 18,858 | 11,464 | 15,291 |
| 55-64 | 15,859 | 7,780 | 11,972 |
| 65+ | 10,304 | 4,785 | 7,646 |
| Average | 16,550 | 10,142 | 13,476 |
What this means is that anyone doing an analysis for themselves should use their own mileage patterns.
When it comes to second-hand car value this is an area that is fraught with danger when doing an analysis. Firstly I believe that as electric cars are adopted we have going to see big variations and changes in the second-hand market for both electric cars and fossil fuel cars. Secondly predicting that forward for 3-5 years is almost impossible. In the end, you have to fix on a figure to do this sort of analysis.
ARK has fixed on a Camry having only 49% of its value after 3 years. This is based on the predicted values in the Kelley Blue Book. To me, this seems low and again advantages the Tesla which they have said will retain 69% of its value in 3 years. The only personal experience I have with this is that I own a 2016 Toyota Corolla Ascent Sport Hatch Manual. Last week I was offered 66% of its original price as a trade-in after 34 months. That was the first offer and the car has some panel damage on the front which will need to be repaired. One of the reasons I bought a Toyota, in the end, was that they hold up very well in resale value. The second offer was at 70%.
Again, in the end, people need to make up their own mind about what that future valuation might be and in the ARK model, the vehicle would have done 72,000 km whereas mine has only done 32,500km. Of course, if we use the lower average mileage figure from the US Dept of Transportation then the vehicle would have only done 65,000 km in 3 years rather than the 72,000km that is in the ARK model. This would again change the model.
One other way to look at this is to calculate the finance package available from Toyota. If I apply a 3-year finance package to a Toyota Camry then Toyota gives me a guaranteed future value they will pay for the vehicle to take it back. At 20,000 km per year that value is A$12,314 which is only 41.4% of the original purchase price of $29,726 (net of stamp duty and registration costs). If we drop the mileage to 15,000 km a year then the percentage is 43.6% and at 10,000km a year the value is 46.1%. The Toyota finance system is designed to give buyers certainty and also make sure Toyota does not lose money if they take cars back so it will consistently undervalue the car at the end of its lease period. When I bought my Toyota Corolla and leased it for four years the buyback value was 41% at four years. There is no way I would hand it back for that price. 2015 models that are that age now are listed for sale here in Australia at 70% of the value of the vehicle that I purchased. In the end, I think that the 3-year valuation is too low but The Kelley Blue Book has a good reputation so readers should make up their own minds.
Other Costings
One of the numbers that confuses me is that maintenance costs that ARK have applied. I have no doubts that electric vehicles will have lower maintenance costs than fossil fuel cars just because they have less moving parts. The reality is that fossil fuel cars have made big advances in reducing maintenance costs, especially in the first 5 years. However, ARK has applied US$1,088 per year in maintenance costs to the Toyota Camry or A$1541 (at 0.7183 exchange rate). I cannot work this out as Toyota in Australia offers fixed price servicing for the Toyota Camry at A$195 per year 15,000 km. That is only A$975 over 75,000 km. If we throw in two sets of tyres at A$580 a set that then is only A$2,175 over 3 years compared to Arks costs of A$4,623.
The ARK model cites the AAA cost of Ownership document from 2018 which is a reputable resource and is similar to the analyses produced in Australia by bodies like the RACV. However, it is not representative of vehicle costs over a 3 year period because fossil fuel cars have low initial costs of maintenance and higher costs later so applying an average cost for a 3-year assessment does not really work. I would argue that the higher costs of maintenance for future years are built into the low resale value at three years and so counting high maintenance costs in the first three years of operation and then having a low resale value double counts some of those costs. To adjust these figures I have used an annual cost of U$600 which takes in tires and capped price servicing while still allowing for some minor pieces of extra maintenance or replacements.
The Results
In the end none of these changes made a huge amount of difference, although we will see that in the Australian context this is not true.
The comparison is as follows in terms of cost per mile over three years in US dollars:
| ANALYSIS | Cents Per Mile |
| ARK Analysis of the Tesla Long Range Model 3 | 51 |
| My Analysis of the Tesla Long Range Model 3 | 56.5 |
| ARK Analysis of the Toyota Camry | 57 |
| My analysis of the Toyota Camry with 49% residual | 59.5 |
| My analysis of the Toyota Camry with 60% residual | 52.7 |
You will be able to access the spreadsheet models soon but the main differences are:
- 13,476 miles per year instead of 15,000 miles per year with gas charges and charging costs changed to match.
- US$600 for the maintenance of the Toyota as mentioned above.
Conclusion
So in the USA situation the Tesla 3 cost of ownership using my figures is somewhere a little above or a little below the cost of the Toyota Camry depending on what resale value you choose.
As we will see the situation in Australia is totally different for a number of reasons. That information will be available in the second half of this post that will be posted later today along with access to the spreadsheets so anyone can revise the numbers or tear them apart and critique them.
Access to the ARK model is available HERE or if that causes any issues you can go via The Clean Technica article


