Is a Tesla Model 3 Really Cheaper to Own than A Toyota Camry? Part 2 – Australia
It turns out there is a huge difference between owning a Tesla 3 in The USA versus Australia


There have been a number of articles written recently on the analysis by ARK investments on a Tesla 3 being cheaper to own on a per mile basis than a Toyota Camry including on The Driven and Clean Technica
I have done a deeper dive based on a look at the model that ARK has used and also using Australian numbers to look at the application of the numbers for the Australian market. Due to the complicated nature of the question I have split this into two posts. The first is on the ARK model in the USA which can be seen HERE. This second one is on looking at that model in an Australian context.
In order to make the post more readable, I have kept some of the detailed analysis in an addendum at the bottom of this post which also includes access to the ARK model.
The short story from the USA assessment was that using the ARK model or using my adjusted model the costs of owning a Toyota Camry and a Tesla 3 model are fairly close together on a cost per mile traveled basis.
The Australian Model
If we look at an Australian model there are several other factors that change the economic analysis. These include:
- New vehicle prices (especially Tesla vehicles)
- Mileage in Australia conditions.
- Fossil fuel prices are higher in Australia because of fuel excise taxes.
- Electricity energy costs which vary quite a lot depending on where you charge
The details of all of these are below in the addendum but the headline numbers are as follows:
New Vehicle Prices
- The prices for a new Toyota Camry are approximately equivalent to the US version that ARK has used in their model. So I have used A$29,726 for the base model Toyota Camry Ascent.
- The price for a long-range Tesla 3 is a bit more problematic. You can see the longer explanation below in the addendum but I have used A$71,951 based on the current exchange rate and extra margins on Teslas compared to the USA. The difference is also larger because there is a subsidy for Tesla purchases in the USA but not in Australia.
- I have also included A$2,000 for an installed home charger on the basis that most people will charge at home and energy costs will generally be lower there.
Mileage in Australia conditions
I have used 12,600 km traveled per year as the average distance. 15,000 or 15,600 (300km a week) is commonly used but there are good reasons for the lower figure I have used as explained in detail in the addendum.
Fossil Fuel Prices
Fossil fuel prices are higher in Australia because of fuel excise taxes. I used the 14-day average price on the RACV site from April 4th, 2019
Electricity Prices for Charging
I have used a range of prices from a lower solar feed-in tariff to a higher single use grid tariff. These are all based on prices in my areas of Melbourne These are all based on people mainly charging from home. For the assessment here I used the figure in the middle of 18.62 cents per kWh representing a mixture between home solar and grid charging. The reality is that this resulted in a cost of 2.8c per km so at half the rate or 50% higher this only makes a difference of 1.4 cents per km which is not material given the massive differences between the costs of the two vehicles in this comparison.
Other Costs
Stamp Duty: In Victoria (where I live), Stamp duty is 4.2% up to $66,331 and 5.2% for vehicles above that.
Car registration: In Victoria where I live this covers both car registration and a compulsory payment for TAC insurance. It is $816.50 for the Metro area.
Tesla Mileage: 6.67km per kwh based on 500km range and 75kwh battery
Insurance: I used Compare the Market to get the rate on comprehensive insurance for the Camry. The second highest quote was $620.
Car Values (residual values) at the end of 3 years. See the Part 1 post for more detail on this. I have chosen 69% residual value on the Tesla and 60% on the Camry.
Maintenance and Tyres: See the Part 1 Post for more discussion on this. I have put in the capped price servicing per year for the Toyota Camry as advertised by Toyota and $580 for a new set of tires over the 37,800 km traveled. Based on my personal experience of the last 3 years there have been no extra costs. For the Tesla, I have assumed 2/3 of the maintenance costs of the Camry plus a set of tires.
Conclusion
You can head to the Google Sheets that I created for the detailed analysis (or look at the spreadsheet details embedded as images in the Addendum below).
The results are that I estimate that there is a massive difference between the total ownership costs of owning a Tesla Model 3 Long range vehicle in Australia and a Toyota Camry:
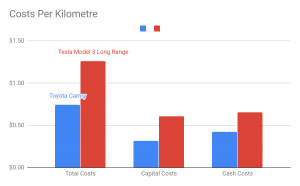
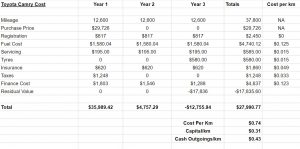
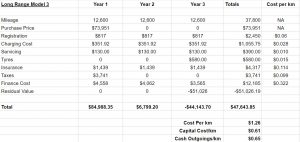
The Tesla costs $1.26 to run and the Camry $0.74 which is broadly in line with the RACV figures for the Toyota Camry.
The difference is solely related to the price of the vehicle with much higher depreciation amounts despite lower rates of depreciation and much higher financing costs because of the higher purchase price.
Note: The capital costs in the chart are just depreciation. The cash operating cost includes interest whether real or assumed
You can access the actual spreadsheets by going to Paul Higgins Google Sheets Tesla V Camry Analysis if you want to see all the calculations. They should be read in conjunction with the notes above and the Addendum below.
You can find the original Ark model spreadsheets HERE. If they cause a problem then you can follow them from the Clean Technica Article.
Addendum – Australian Model
New Vehicle Prices
The prices for a new Toyota Camry are approximately equivalent to the US version that ARK has used in their model. So I have used $29,726 for the base model Toyota Camry Ascent based on figures from Toyota and Cars Guide. This is A$31,791 as advertised with the stamp duty insurance costs taken out and placed in the spreadsheet model separately as per the ARK model.
The price for a long-range Tesla 3 is a bit more problematic. There are two factors at play here. The first is the subsidies available in the USA are generally not available here in Australia. The second is that there is what has been termed a “Tesla Tax”. At Reneweconomy Alex Shoolman did a great job of working this out and ended up with a difference of roughly A$20,500 between the price of a Tesla in the USA in Australian dollars and the price in Australia retail for a Tesla model S. This excluded the luxury car tax. That was when the Australia dollar was 0.7986 to the US dollar. Currently (April 18th), it is 0.7183. It is difficult to know what the difference in cost for a Tesla 3 would be because the difference between US prices and the Australian retail price is made up of shipping costs as well as charging what the market can bear. Clearly, it does not cost A$20,500 to ship a car to Australia so some extra margin for the market is included. If we take the raw price that ARK has included in their model of US$44,500 for the long-range Tesla Model 3 and convert it into Australia dollars at the current rate we get $61,951. If we then apply half the difference between the Tesla S US price and the Tesla S Australian price this gets us to $71,951 before tax. This is a reasonable estimate before we know what the prices will be and also is under the luxury car threshold. This is the estimate I have used for the moment. It also has the advantage when comparing the model I am using to the ARK model of roughly keeping the ratio of new car prices roughly the same.
Mileage
The Australia Bureau of Statistics has some excellent information on travel distances. The normal number that people use is 15,500 km as stated in the Roy Morgan Survey form 2013 but as can be seen in the following graphic from the report there are considerable differences between vehicles and the number is skewed a little high by the light commercial vehicles that are included.
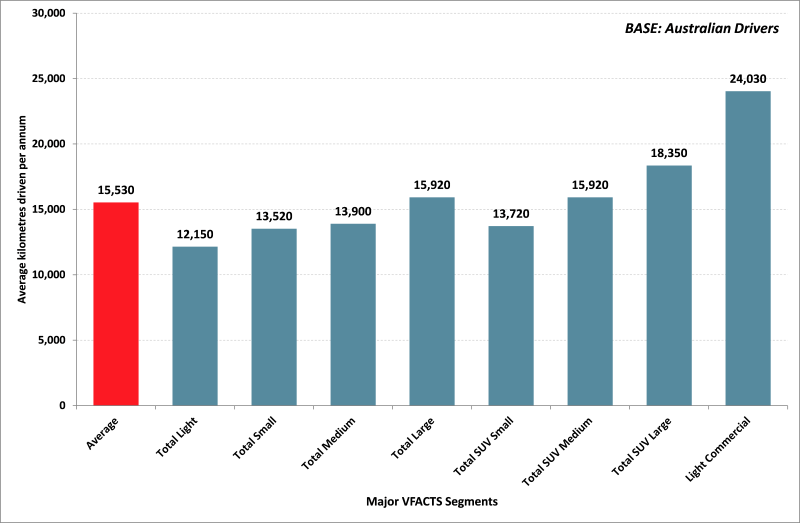
http://www.roymorgan.com/findings/australian-moterists-drive-average-15530km-201305090702
ABS data also shows significant variation between the states:
http://www.abs.gov.au/ausstats/abs@.nsf/mf/9208.0
The ABS data says that the average passenger vehicle travels 12,600 km so because of all the variation I will use that figure for the model.
Electricity Energy Charges
Charging Costs: I have put in a range of costs. 10c per kWh is the solar input tariff I used to be on and is fairly standard. Solar at 15c per kWh is my current feed-in tariff. Both these assume that I will charge 100% at home using a smart charger system that allows me to charge when I have excess solar. The low grid level I have used is 18.62c per kWh which is the night load system I used to be on and assume charging off the grid at night. The high grid cost is my current single-use tariff. All of these assume charging at home which is my long term view. Most people do not travel that far and charging at home to keep the battery between 20 and 80% for longevity reasons is the most likely pattern. Of course, there will be ranges between these that are different for everyone. I have used the low-cost grid charge as a price somewhere in the middle for this calculation.
Financing Model
I was taught long ago that to be honest about financing a piece of equipment you should set the lease terms so they match the real depreciation value of the asset. Therefore I have calculated the interest costs on the basis of the balloon payment at the end of the 3 years being equal to the residual value in the calculations. This means that in year one the interest rate of 6.5% has been applied to the average of the starting price and the finishing value at the end of year one. The starting price is the purchase price of the car. The finishing value at the end of year one is the starting price minus one-third of the difference between the car purchase price and the car value at the end of the three years. This could be calculated in other ways but the difference is minimal for the purposes of this exercise.
Detailed Analyses
You can access the actual spreadsheets by going to Paul Higgins Google Sheets Tesla V Camry Analysis if you want to see all the calculations. Here are the images from that file: